Chapter 9: Reading a Keepa chart
What you'll learn: what a price-history chart shows, the four patterns worth recognizing (including the Q4 pattern), and how to use history to judge whether a product's price and sales will hold up.
Why history matters
Today's price and rank are a single moment. A product's history shows what usually happens: how often it sells, the price it normally sells at, who else sells it, and whether this time of year is typical. It's your best protection against buying at a temporary price spike.
You can read history in two places:
- ArbiSource's graph on every result: price and rank over 30, 90, 180 or 365 days. Click the graph to enlarge it, and click a line's name to show or hide it.
- Keepa, a separate price-tracking service for Amazon with longer, more detailed histories. It has free and paid options (see keepa.com for current details). Add a Keepa button to your result panels so any product opens on Amazon.com's Keepa page in one click:
https://keepa.com/#!product/1-{ASIN}(4.3).
Both show the same kinds of line, so once you can read one, you can read the other.
The main lines
| Line | What it shows | What to look for |
|---|---|---|
| Sales rank (BSR) | The product's rank over time | Frequent drops (downward spikes) mean regular sales |
| Amazon price | When Amazon itself sells the product, and at what price | Whether Amazon is on the listing, and how often it's in stock |
| Buy Box price | The price of the offer most customers buy from | The price you'll realistically sell at |
| Lowest new FBA price | The cheapest FBA offer | Your direct competition |
| Lowest new FBM price | The cheapest offer shipped by the seller rather than Amazon (FBM, Fulfilled by Merchant) | Usually less competitive with Prime shoppers, but worth noticing |
| Offer count | How many sellers are on the listing over time | Whether competition is growing |
Keepa uses colored lines with a legend, and you can turn each line on or off by clicking its name. Start with just the sales rank, Buy Box price and Amazon price, then add the rest.
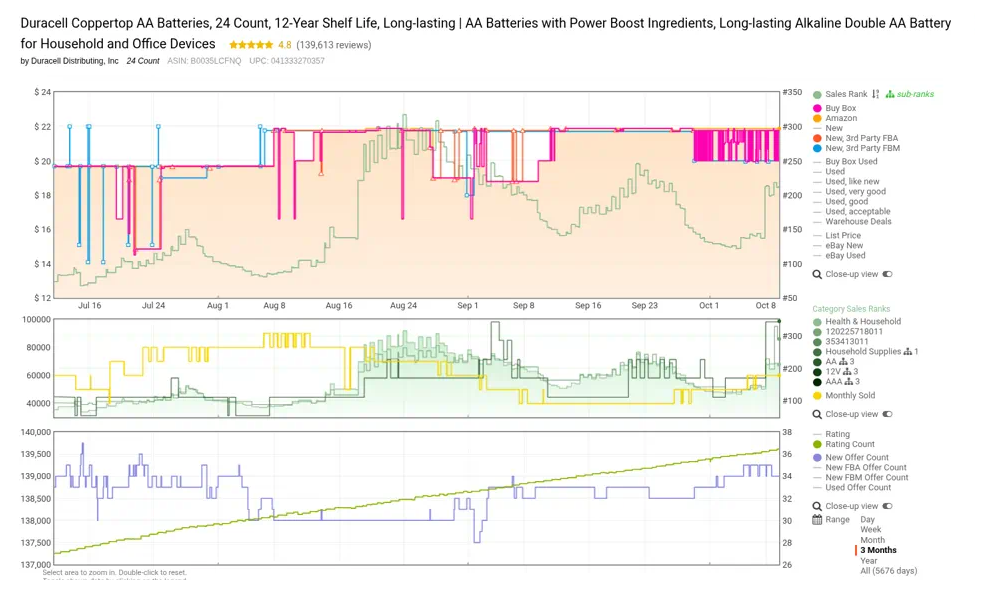
Keepa 90-day chart for Duracell AA batteries on Amazon.com. Top: Buy Box, Amazon and other price lines with the sales rank. Middle: category ranks and monthly sales. Bottom: offer count and ratings. Click a name in the legend to show or hide its line.
Reading sales from the rank line
Each sharp drop in the rank line most likely marks a sale. Count the drops over a month and you have a rough idea of how often the product sells (across all sellers, not just one).
- Plenty of drops, evenly spaced: steady demand.
- Drops bunched together, then nothing: sales came in a burst, perhaps during a promotion or a busy season.
- A flat or rising line for weeks: very few sales.
ArbiSource counts the drops for you: the number of BSR drops for 30, 90, 180 and 365 days is in each result panel (Chapter 8).
Four patterns worth recognizing
1. The steady seller. Regular rank drops and a Buy Box price that stays within a narrow band. These are the products to build a business on, even when the profit per unit is modest.
2. The price spike. The Buy Box price leaps well above its usual level, often because stock ran low or Amazon sold out. A lead that only works at the spike price will probably be back at its normal price by the time your stock is checked in. Check the profit at the average price (Chapter 7), and use the average-profit filter to screen spikes out.
3. Amazon in and out of stock. The Amazon price line comes and goes. While Amazon is in stock it often takes most of the sales, usually at a lower price; when it sells out, other sellers' prices rise. If Amazon is nearly always in stock, be cautious. If it's often out for long stretches there can be a real opportunity, but base your numbers on the price when Amazon is in stock.
4. The seasonal product. Rank and price improve at the same point every year. On Amazon.com the biggest of these is Q4: from October through the holidays, demand rises across most categories, and toys, electronics and gift sets can sell many times faster than in spring. There are smaller peaks too, such as back-to-school and summer outdoor products. Look back at least 12 months. Buying a seasonal product as its season ends can leave you holding stock (and paying storage) for months.
so last year's chart is your best guide to this year's. Expect higher sales and higher storage and fulfillment fees at the same time (Chapter 5), and stock arriving late to miss the peak. Chapter 32 covers planning for it.
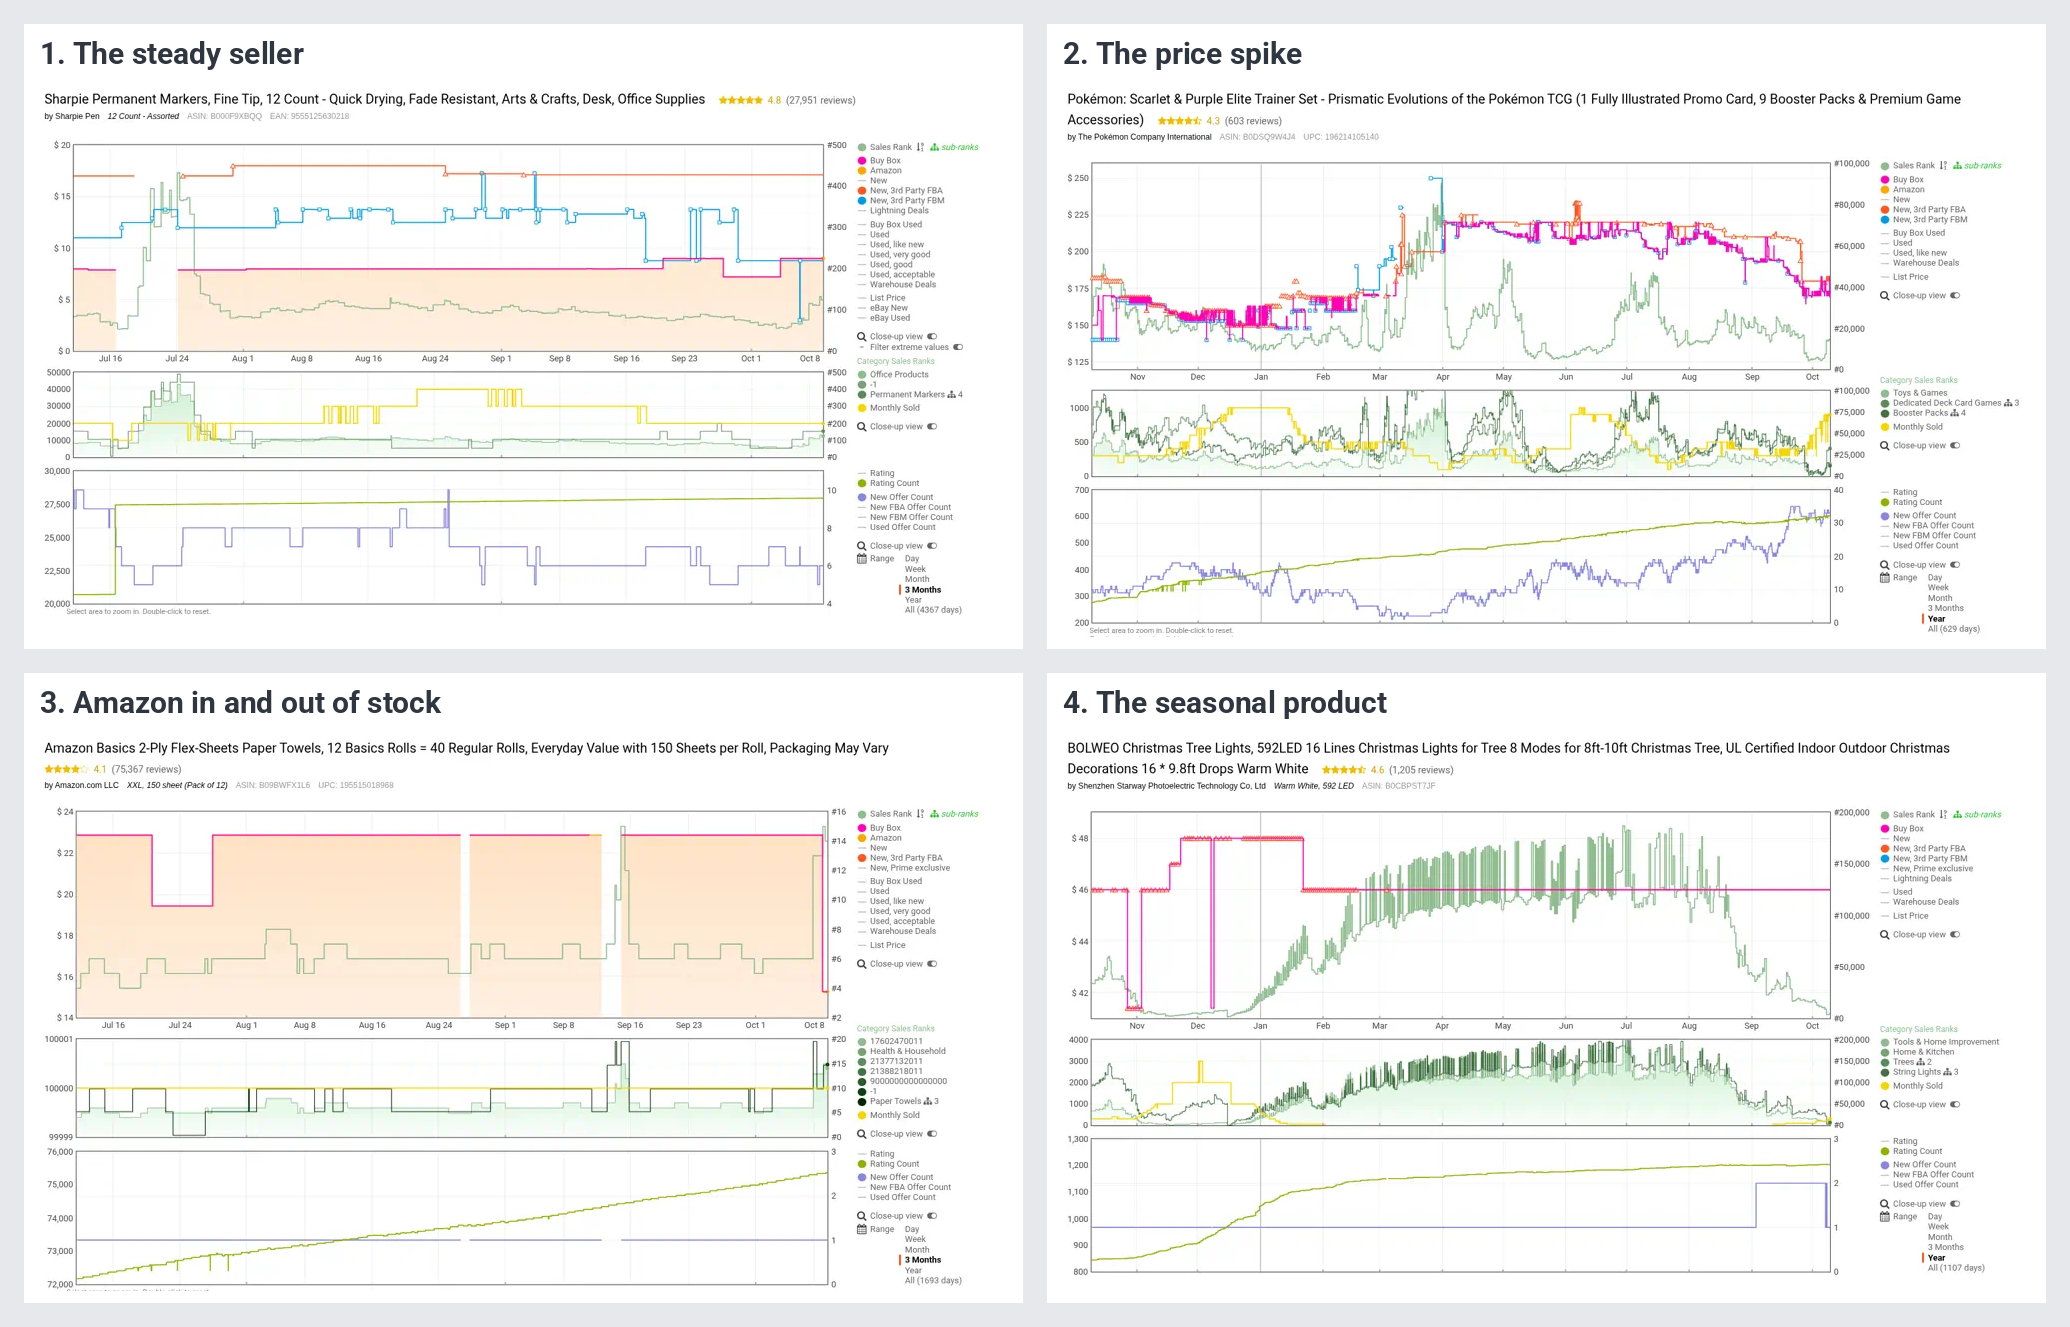
The four patterns on real Amazon.com Keepa charts: 1. the steady seller (90 days), 2. the price spike, when stock ran short (12 months), 3. Amazon in and out of stock (90 days), and 4. the seasonal product, with Christmas tree lights rising in the holiday season (12 months).
A two-minute history check
For each lead, work through these questions:
- Sales: are there regular rank drops over the last 90 days?
- Price: what's the usual Buy Box price over 90 to 180 days? Is the profit still good at that price?
- Amazon: is Amazon on the listing, and how often is it in stock?
- Competition: is the number of offers steady or climbing?
- Season: does the last 12 months show a seasonal pattern, and where are we in it?
If the answers are mostly reassuring, the product is green for Momentum in the Lead Check (Part 5). If one is uncertain, it's amber: a Test-buy if everything else is green. If several are shaky, Watch it on your Sourcing List; and if it plainly doesn't sell, it's red: Pass.
See it in action
Checklist
- I've added a Keepa button for Amazon.com (domain 1) to my result panels
- I can find the sales rank, Buy Box, Amazon and offer count lines
- I can recognize a steady seller, a price spike, Amazon in and out of stock, and a seasonal product
- I check at least 90 days of history, and 12 months for anything seasonal, especially ahead of Q4